Debugging Python Applications Like a Pro: Advanced PyCharm Techniques
Debugging is an essential skill for every Python developer, and PyCharm provides a comprehensive suite of powerful debugging tools that can dramatically improve your productivity. In this guide, we'll explore advanced debugging techniques that will help you identify and fix bugs faster, making you a more efficient developer.
Understanding Breakpoints: Your First Line of Defense
Breakpoints are the foundation of effective debugging in PyCharm. They allow you to pause program execution at specific points, giving you the opportunity to inspect variables, evaluate expressions, and understand the flow of your application. PyCharm offers several types of breakpoints, each serving different debugging scenarios.
Line Breakpoints
The most common type of breakpoint is the line breakpoint. Simply click in the gutter next to any line of code, and PyCharm will pause execution when that line is reached. You can set multiple breakpoints throughout your code to track the execution flow across different functions and modules.
def calculate_total(items):
    total = 0
for item in items:
        # Set a breakpoint here to inspect each item
        total += item['price'] * item['quantity']
    return total
Conditional Breakpoints
One of PyCharm's most powerful features is conditional breakpoints. These breakpoints only trigger when a specific condition is met, allowing you to focus on problematic scenarios without stopping at every iteration. Right-click on a breakpoint and add a condition to make it conditional.
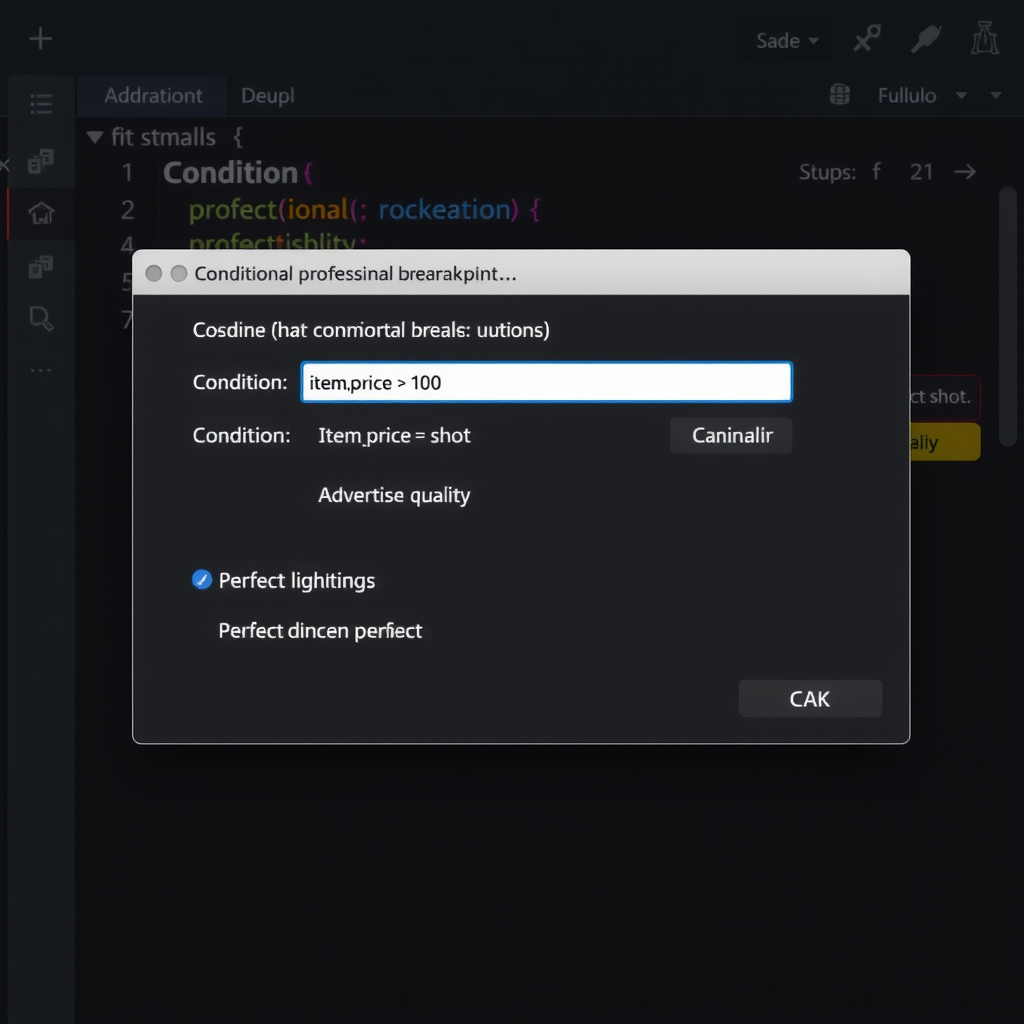
For example, if you're debugging a loop that processes thousands of items but only want to stop when a specific condition occurs:
# Breakpoint condition: item['price'] > 1000
for item in inventory:
    process_item(item)  # Breakpoint here with condition
Variable Inspection and Watches
When execution is paused at a breakpoint, PyCharm's Variables pane becomes your window into the application's state. You can inspect all local and global variables, expand complex objects, and even modify values on the fly to test different scenarios without restarting your application.
Adding Watches
Watches allow you to monitor specific expressions throughout your debugging session. Instead of searching through all variables, you can add watches for the exact values you care about. PyCharm will evaluate these expressions at each breakpoint and display the results prominently.
len([x for x in items if x.is_valid]) to quickly see computed values without writing temporary debug code.
The Debug Console: Interactive Debugging
PyCharm's debug console is an interactive Python REPL that runs in the context of your paused application. This means you can execute any Python code, call functions, create objects, and test hypotheses without modifying your source code or restarting the debugging session.
Practical Debug Console Usage
When your program is paused, open the debug console and try these techniques:
# Inspect variable contents
>>> print(user_data)
{'name': 'John', 'age': 30}

# Test a function with different inputs
>>> validate_email('test@example.com')
True
# Check object types and attributes
>>> type(response)
<class 'requests.models.Response'>
>>> dir(response)
['status_code', 'headers', 'json', ...]
Step Execution: Controlling Program Flow
PyCharm provides several stepping commands that give you fine-grained control over program execution. Understanding when to use each command is crucial for efficient debugging.
Step Over (F8)
Executes the current line and moves to the next line in the same function. If the current line contains a function call, it executes the entire function without stepping into it.
Step Into (F7)
Steps into the function call on the current line, allowing you to debug the called function. This is essential when you need to understand what's happening inside a function.
Step Into My Code (Alt+Shift+F7)
Similar to Step Into, but skips library code and only steps into your own code. This is incredibly useful when you don't want to debug through third-party libraries.
Step Out (Shift+F8)
Completes execution of the current function and returns to the calling function. Use this when you've stepped into a function but realize you don't need to debug it further.
Exception Breakpoints: Catching Errors Early
Exception breakpoints are a powerful feature that automatically pauses execution when a specific exception is raised, even if it's caught by a try-except block. This is invaluable for tracking down the root cause of errors that are being silently caught and handled.
To set an exception breakpoint, go to Run → View Breakpoints (Ctrl+Shift+F8) and click the + button to add a Python Exception Breakpoint. You can specify which exception types to catch, and even configure whether to break on caught or uncaught exceptions.
try:
    result = process_data(data)
except ValueError as e:
    # With exception breakpoint on ValueError,
# debugger will pause here even though exception is caught
log_error(e)
    result = None
Real-World Debugging Scenario
Let's walk through a practical debugging scenario. Imagine you have a data processing pipeline that occasionally produces incorrect results, but only with certain input data.
def process_transactions(transactions):
    total = 0
    processed = []

    for transaction in transactions:
        # Set conditional breakpoint: transaction['amount'] < 0
if validate_transaction(transaction):
            amount = calculate_amount(transaction)
            total += amount
            processed.append(transaction)

    return total, processed
Here's how to debug this effectively:
- Set a conditional breakpoint on the validation line with condition
transaction['amount'] < 0to catch negative amounts - Add watches for
totalandlen(processed)to monitor progress - Use Step Into to examine the
validate_transactionfunction when suspicious data is encountered - Use the debug console to test
calculate_amountwith different inputs - Set an exception breakpoint for
KeyErrorto catch missing dictionary keys
Best Practices for Effective Debugging
1. Use Conditional Breakpoints Liberally
Don't waste time stepping through hundreds of iterations. Set conditional breakpoints to stop only when interesting conditions occur. This is especially valuable in loops and recursive functions.
2. Leverage the Debug Console
The debug console is your experimentation playground. Use it to test hypotheses, try different function calls, and explore object properties without modifying your code.
3. Master Keyboard Shortcuts
Learn the keyboard shortcuts for stepping commands (F7, F8, Shift+F8). This will make your debugging sessions much faster and more fluid.
4. Use Exception Breakpoints for Silent Failures
When errors are being caught and handled, exception breakpoints help you see exactly where and why exceptions are occurring, even if they don't crash your program.
5. Organize Your Breakpoints
Use the Breakpoints dialog (Ctrl+Shift+F8) to manage all your breakpoints in one place. You can temporarily disable breakpoints without removing them, making it easy to switch between different debugging scenarios.
Advanced Techniques: Evaluate Expression
PyCharm's "Evaluate Expression" feature (Alt+F8) allows you to execute complex expressions and see the results immediately. This is more powerful than the debug console for one-off evaluations because it provides a dedicated dialog with syntax highlighting and code completion.
You can use it to:
- Test complex list comprehensions and generator expressions
- Call methods on objects with different parameters
- Evaluate mathematical expressions with current variable values
- Check the results of string formatting and manipulation
- Inspect the return values of function calls without modifying code
Debugging Multi-threaded Applications
PyCharm excels at debugging multi-threaded Python applications. The Threads panel shows all active threads, and you can switch between them to see what each thread is doing. When a breakpoint is hit in one thread, you can examine the state of other threads without resuming execution.
Conclusion
Mastering PyCharm's debugging tools transforms the debugging process from a frustrating chore into an efficient, systematic investigation. By leveraging conditional breakpoints, the debug console, variable inspection, and advanced stepping techniques, you can identify and fix bugs significantly faster than with traditional print-statement debugging.
The key to becoming proficient is practice. Start incorporating these techniques into your daily development workflow, and you'll soon find yourself debugging complex issues with confidence and speed. Remember that effective debugging is not just about finding bugs—it's about understanding your code's behavior and building more robust applications.
Happy debugging, and may your breakpoints always hit at the right moment!